Solar monitoring system
Solar Plant Monitoring: SCADA, Alerts & Dashboards
2026-04-07T00:00:00.000Z•8
A solar plant monitoring system gives your O&M team real-time visibility into every layer of your plant, from string current to grid export, so you can catch yield losses before they become revenue losses.
Without it, you are managing a 100 kW to 10 MW asset with incomplete data.
SCADA is the backbone of any serious solar plant monitoring system. It logs, controls, and reports across all plant devices.
Real-time alerts cut fault response time from days to under two hours when configured correctly.
Performance dashboards built around PR, CUF, and Specific Yield give you and your CFO a single source of truth.
String-level monitoring catches localized issues that inverter portals and basic meters completely miss.
Predictive maintenance powered by monitoring data reduces unplanned downtime by up to 30% compared to reactive O&M cycles.
Most plants between 100 kW and 10 MW still run on inverter portals, local meters, or weekly spreadsheet reports.
These tools tell you what already happened. They do not tell you what is happening right now or why generation dropped 8% last Tuesday.
A proper solar plant monitoring system closes this gap. If you have not yet looked at how solar reduces commercial electricity costs, that context will make the monitoring case even clearer.
A proper solar plant monitoring system closes this gap.
Inverter portals show device-level data but do not correlate it with irradiance, temperature, or string behavior
Spreadsheet reports catch issues days after the loss has already occurred
Basic meters give you kWh totals but no fault codes, no PR trend, no string anomaly data
The result: unexplained yield losses, reactive maintenance cycles, and no credible answer when your board asks why generation fell short of projections.
SCADA (Supervisory Control and Data Acquisition) is the central nervous system of your plant monitoring stack.
It collects data from every device in your plant, inverters, weather stations, meters, protection relays, and string monitoring boxes, and logs it at defined intervals (typically 5 to 15 minutes).
For a structured view of how this fits into overall solar O&M best practices, read our dedicated maintenance guide.
Data acquisition:
Reads voltage, current, power, frequency, temperature, and irradiance from all field devices via Modbus, RS485, or Ethernet
Supervisory control:
Allows remote commands like inverter restart, setpoint changes, and reactive power adjustments
Data logging:
Stores historical performance data for trend analysis, insurance claims, and regulatory reporting
Communication:
Pushes data to cloud dashboards, DAS (Data Acquisition Systems), and DISCOM reporting portals
Feature | SCADA | Inverter Portal |
Data sources | All devices in plant | Inverters only |
String-level visibility | Yes | No |
Remote control | Yes | Limited |
Custom alerts | Yes | Basic |
Historical analytics | Deep | Shallow |
Integration with weather data | Yes | No |
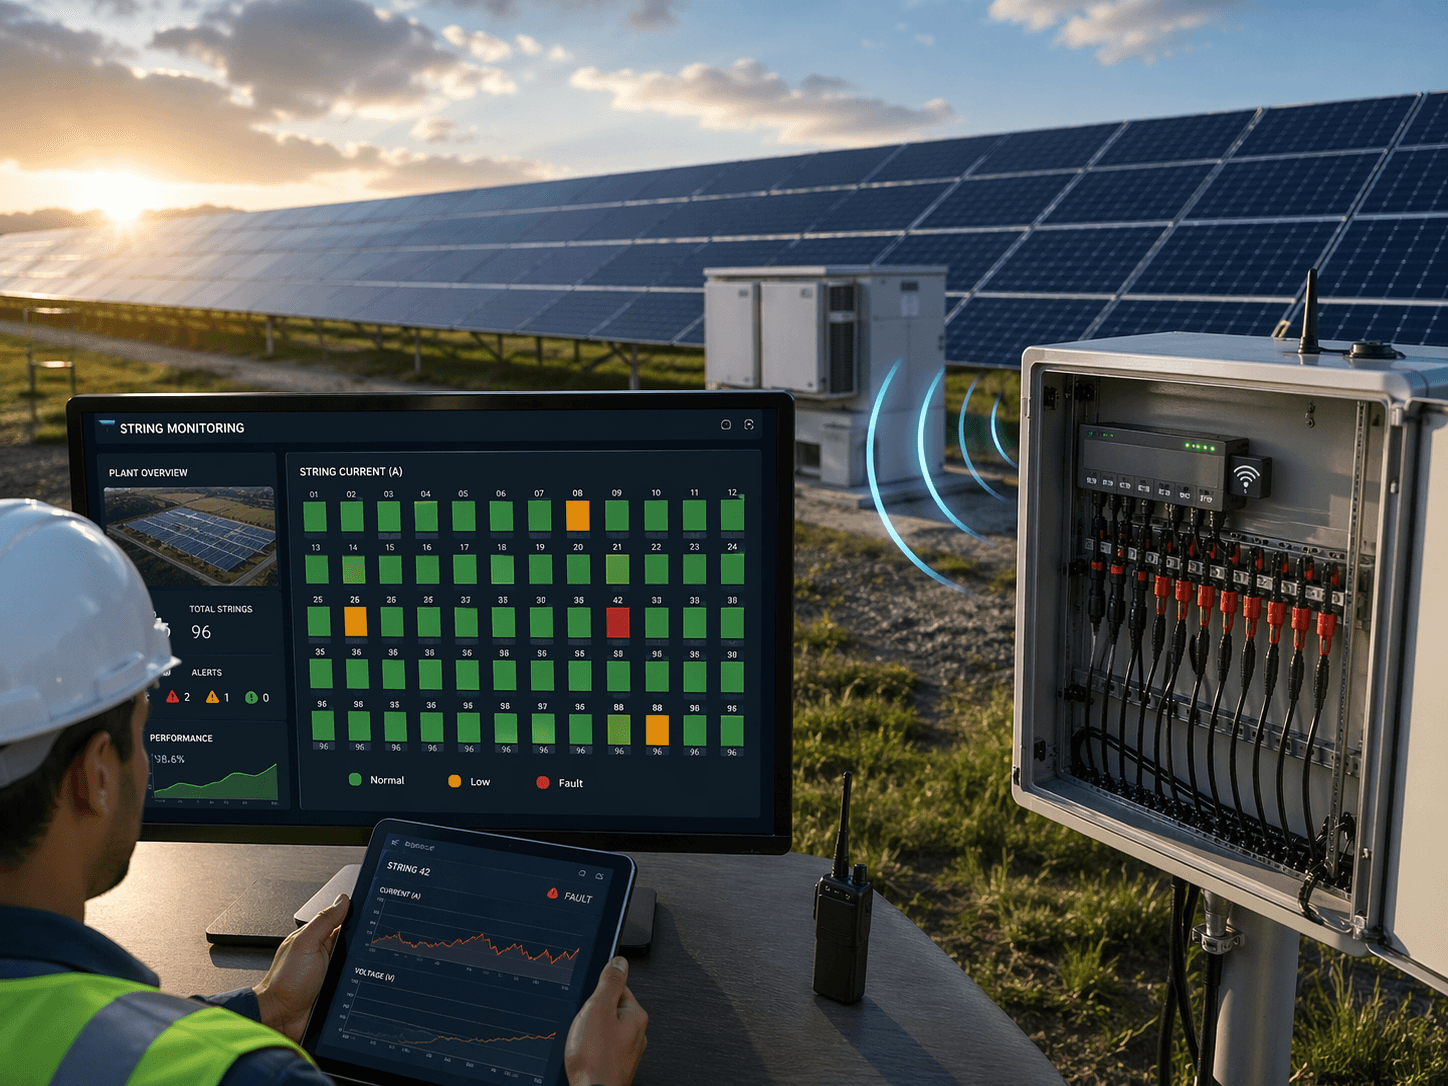
String-level monitoring is the layer most O&M managers underestimate.
It is where soiling, shading, hotspots, and bypass diode failures actually show up first.
Without string monitoring, a single underperforming string in a 200 kW array can silently drag down generation for weeks.
Before choosing your hardware stack, see how Wave Inverters compare to leading brands for string-level visibility built into the inverter itself.
String current (Isc) deviations from expected values
Open circuit conditions indicating disconnection or fuse failure
Reverse current anomalies indicating bypass diode issues
Asymmetric current distribution across parallel strings
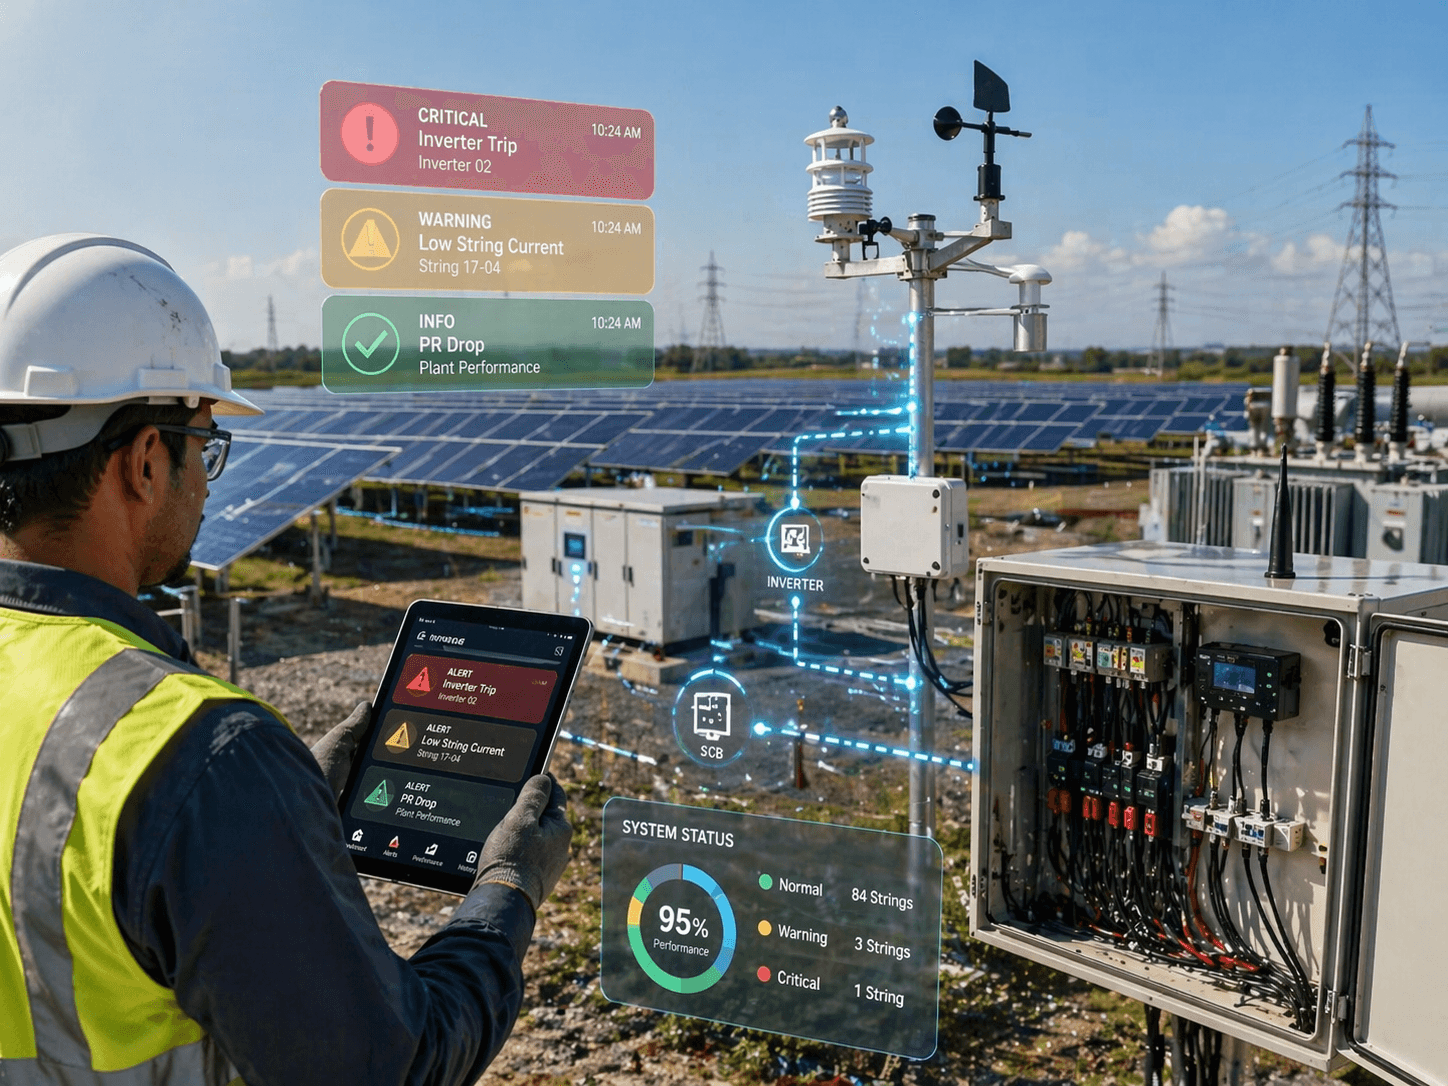
Alerts are only useful if they fire on the right conditions, reach the right person, and give enough context to act.
For industrial plants with high energy demands, a poorly configured alert system can cost weeks of generation loss before anyone notices.
Inverter trip or shutdown
Grid disconnection event
Communication failure for more than 15 minutes
DC string current drop greater than 20%
Performance Ratio (PR) drop greater than 5% versus baseline
Module temperature greater than 75°C
Soiling loss estimate exceeding 3%
Gradual PR degradation over 30 days
Increasing clipping hours due to DC/AC ratio imbalance
Weather-corrected yield underperformance greater than 2%
Route Tier 1 alerts to on-call engineer via SMS and mobile app
Route Tier 2 alerts to O&M manager via email with data snapshot attached
Aggregate Tier 3 alerts into a weekly report for operations director review
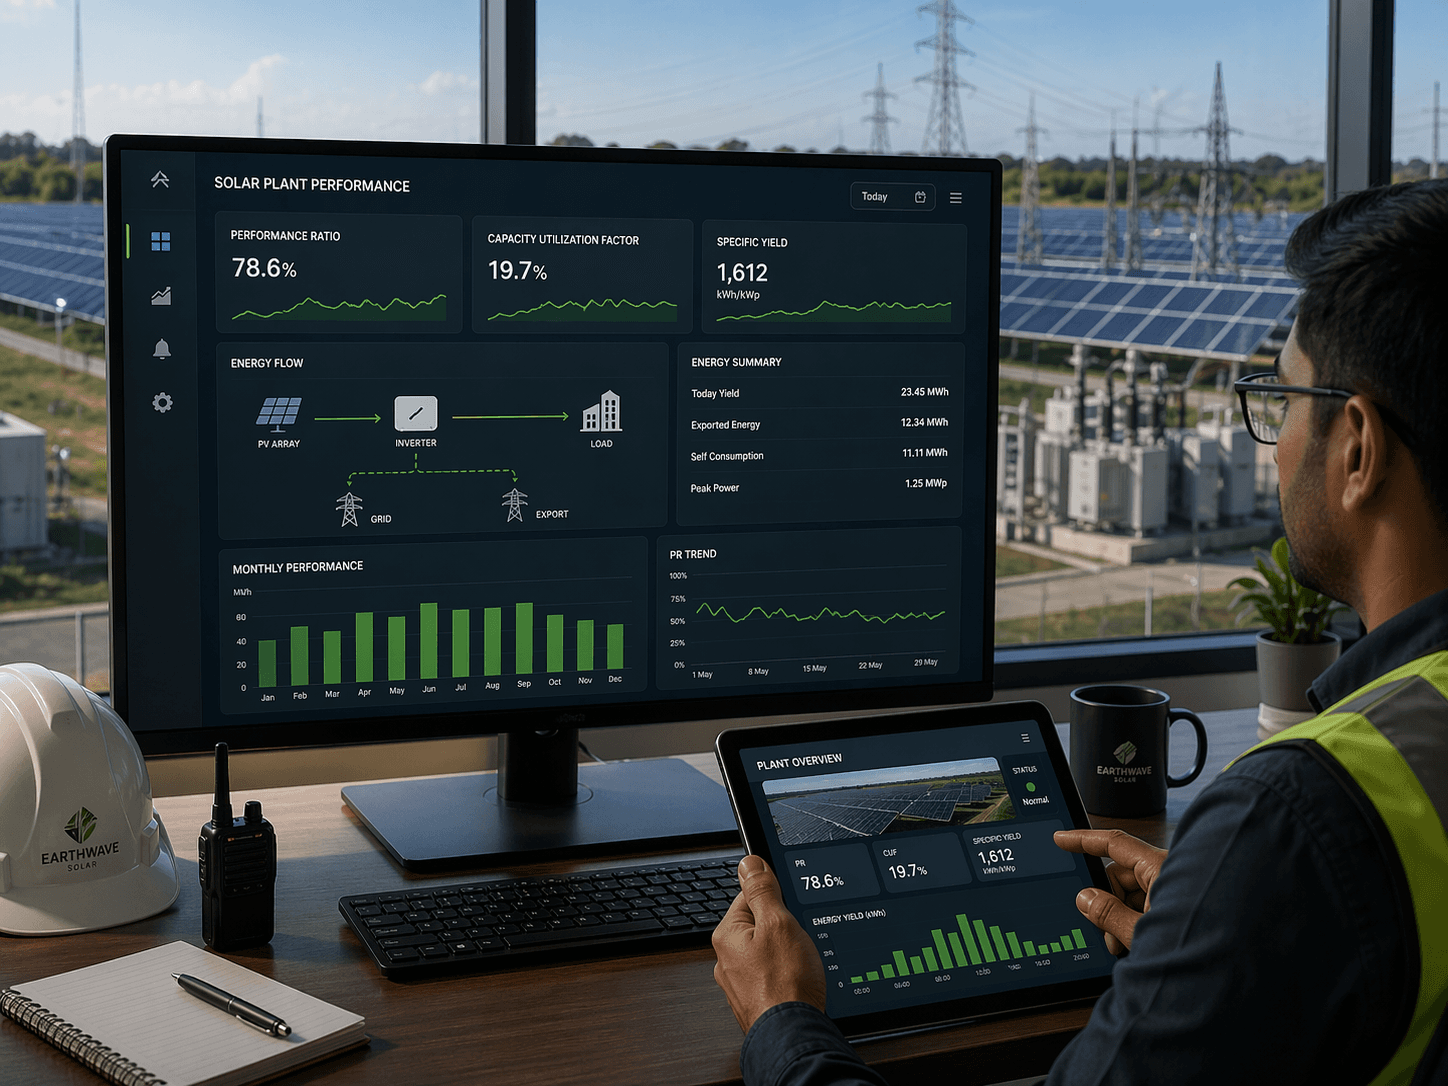
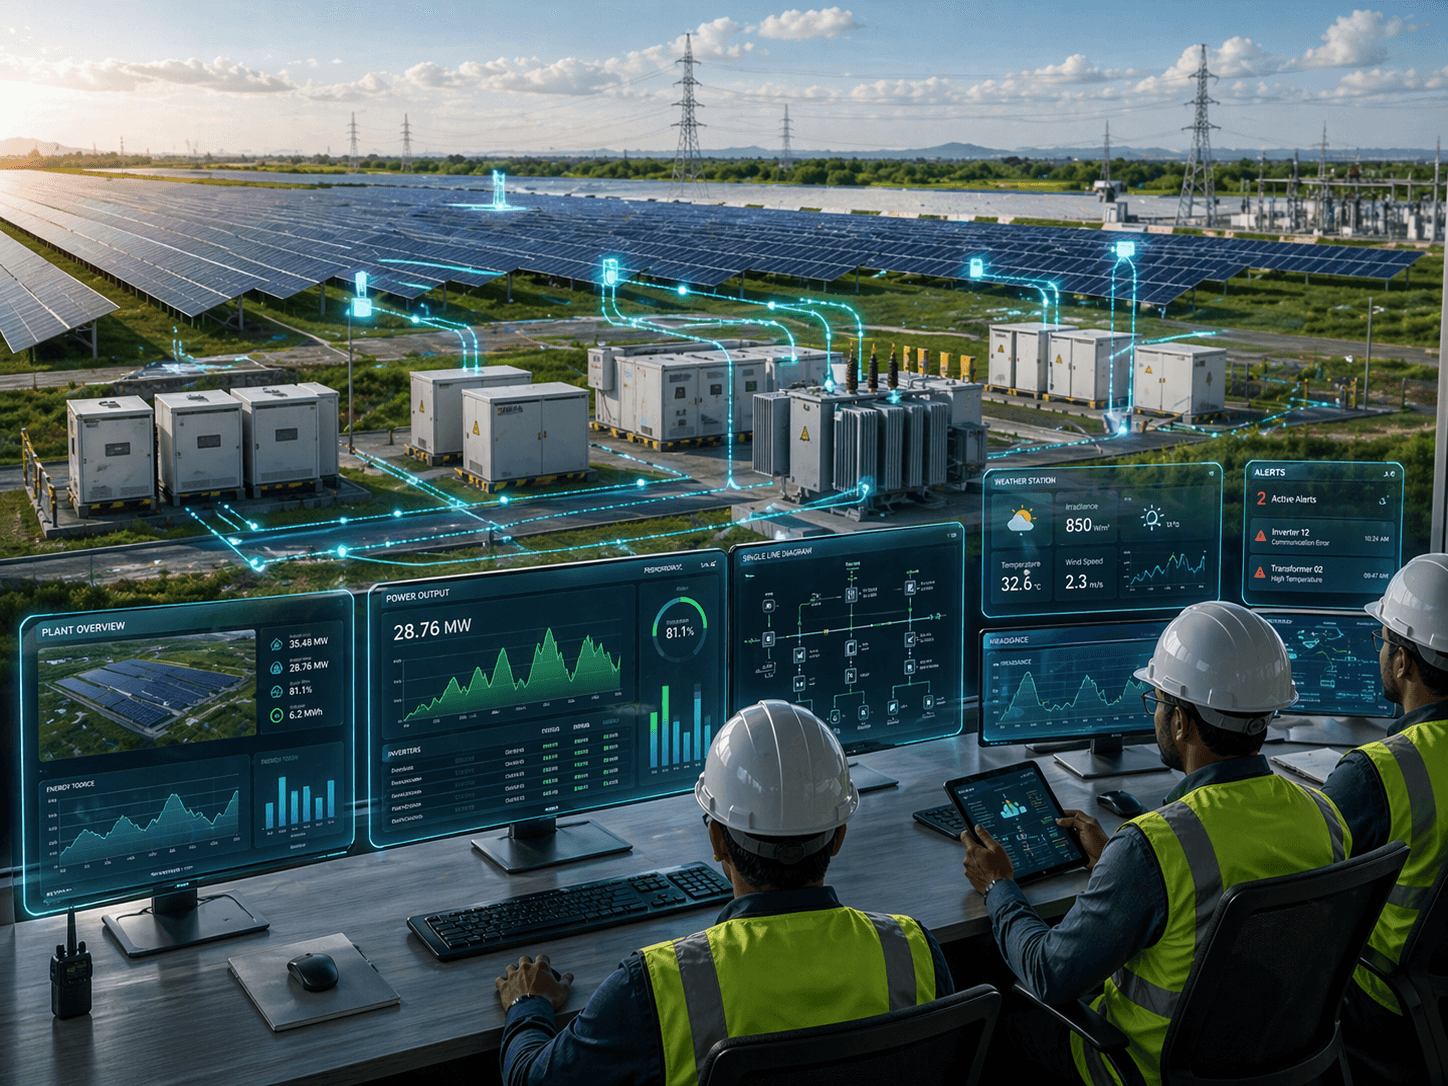
Your performance dashboard is the tool your operations team uses daily and your finance team uses monthly.
It needs to answer two questions instantly: Is the plant performing as designed? Where exactly is it underperforming?
Plants that track these KPIs consistently reduce power expenses by 30 to 40% compared to plants running on reactive O&M alone.
PR measures actual energy output divided by the energy the plant would produce if it operated at nameplate efficiency under the same irradiance.
Healthy benchmark:
PR between 75% and 82% for Indian conditions
Below 70%:
Investigate immediately, likely soiling, shading, or inverter fault
PR should be temperature-corrected
for accurate comparison across seasons
CUF measures how much of the plant's installed capacity is actually used over a year.
India benchmark: CUF of 18% to 22% for rooftop solar in high-irradiance zones like Gujarat
CUF below 15% in a good irradiance zone indicates significant underperformance
Specific Yield shows how many units of energy are generated per kilowatt-peak of installed capacity.
Benchmark for Gujarat: 1,500 to 1,700 kWh/kWp per year
Use this to compare performance across plants of different sizes
KPI | Healthy Range | Warning Zone | Action Required |
Performance Ratio | 75% to 82% | 70% to 75% | Below 70% |
CUF (Gujarat) | 18% to 22% | 15% to 18% | Below 15% |
Specific Yield | 1,500 to 1,700 kWh/kWp | 1,300 to 1,500 | Below 1,300 |
Inverter Availability | Above 98% | 95% to 98% | Below 95% |
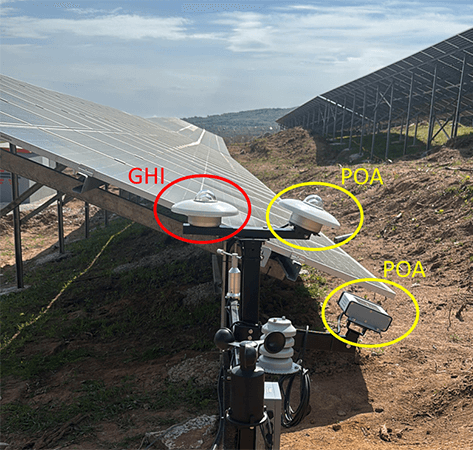
Your performance dashboard is only as accurate as the irradiance data feeding it. Most plants use GHI (Global Horizontal Irradiance) from nearby weather stations.
GHI measures sunlight on a horizontal surface
POA measures sunlight on the tilted panel surface, which is what actually drives generation
The difference between GHI and POA can be 5% to 12% depending on tilt angle and season
Use a POA sensor mounted at the same angle as your panels.
This gives your SCADA system accurate irradiance reference data and makes your PR calculations meaningful.
This is especially important for ground-mounted solar plants where tilt angles vary by site.
Reactive maintenance means you fix problems after they cause downtime. Predictive maintenance means your monitoring system tells you a component is degrading before it fails.
Our full guide on how to maintain a solar system covers the maintenance schedule alongside the monitoring triggers that should feed it.
Fault discovered during weekly site visit or when generation reports look wrong
Average fault-to-fix time: 2 to 5 days
Repeated inverter faults go unnoticed as a pattern
No data for root cause analysis after the fact
SCADA logs anomalies and builds trend data over weeks
Alert fires when a parameter (like IGBT temperature or DC bus voltage ripple) trends outside normal range
Technician arrives with the right spares before failure occurs
Historical data supports warranty claims and insurance documentation
A commercial plant running smart monitoring typically reduces unplanned downtime events by 25% to 35% in the first year compared to a reactive O&M model.
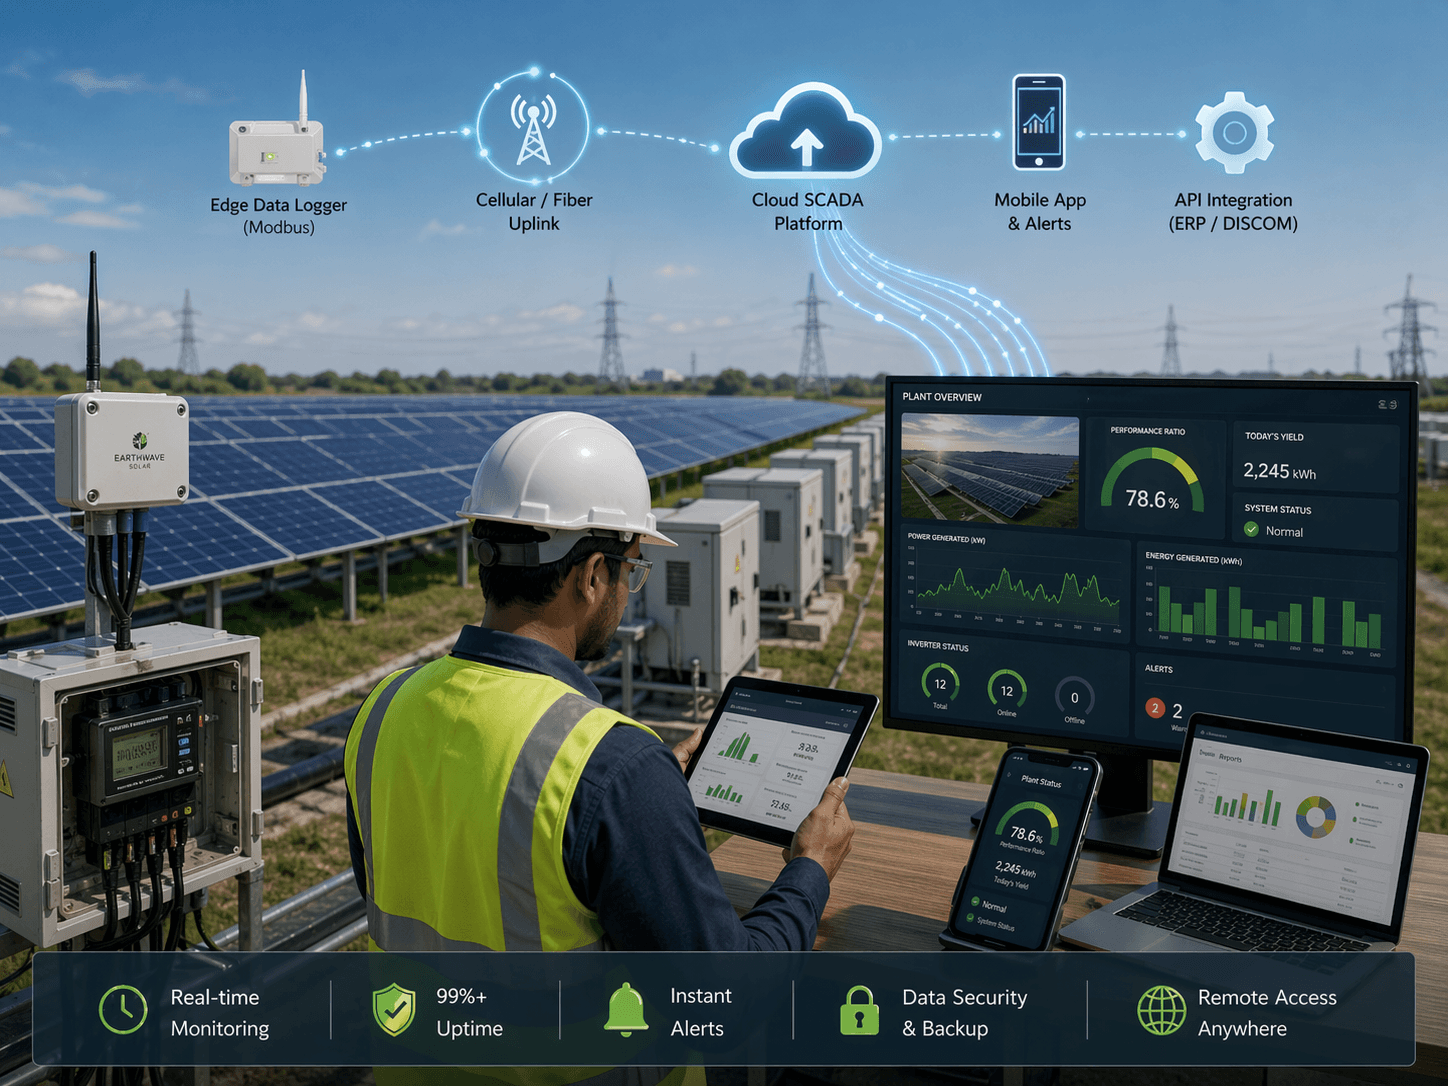
Modern solar plant monitoring systems run on IoT infrastructure. Data loggers at site push readings to a cloud platform every 5 to 15 minutes.
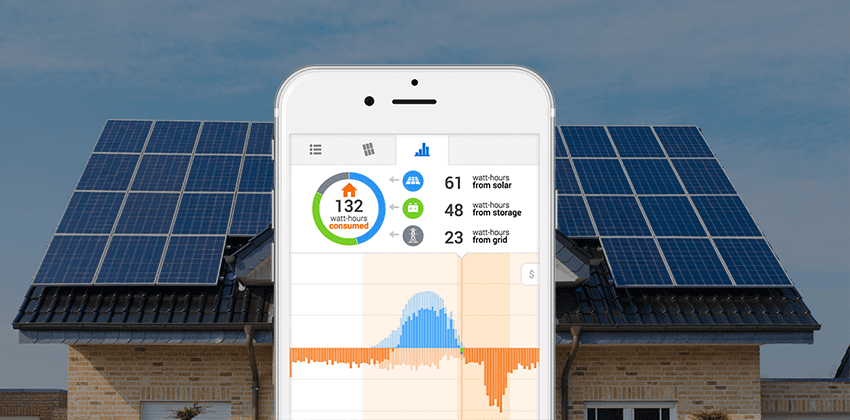
Your O&M manager, operations director, and finance team all see the same live dashboard from any device.
Edge data logger:
Reads Modbus data from inverters, meters, and sensors on site
Cellular or fiber uplink:
Pushes data to cloud platform with redundancy
Cloud SCADA platform:
Stores data, runs analytics, sends alerts
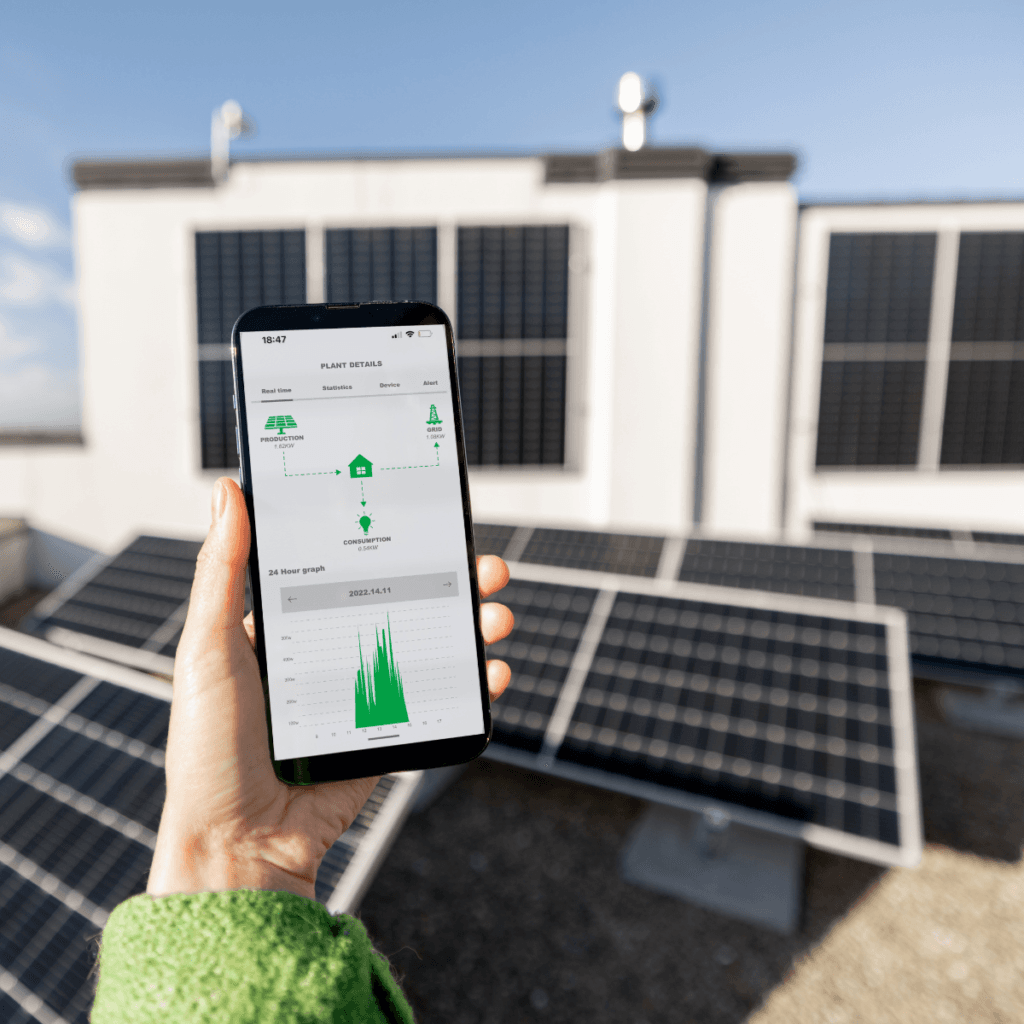
Mobile app:
Real-time plant status, alert notifications, KPI snapshots
API integration:
Connects to billing software, DISCOM portals, or ERP systems
Communication uptime above 99% (gaps in data logging corrupt PR calculations)
Redundant SIM or dual-WAN backup for remote sites
Timestamped data with UTC and IST alignment for accurate reporting
Role-based access so CFO sees financial KPIs and technician sees fault data
Earthwave Solar is a Surat-based EPC company established in 2018, with a track record spanning residential rooftops, commercial and industrial installations, and utility-scale ground mount projects across Gujarat and Madhya Pradesh.
EPC end-to-end delivery:
Site assessment, system design, documentation, installation, and final handover. See the
to know what questions to ask any EPC vendor.
Real-time monitoring:
Commercial and industrial systems
come with real-time monitoring so you always know production and savings
Wave Inverters with Smart Monitoring:
Their in-house
(2.5 kW to 125 kW) delivers up to 97% efficiency and includes smart monitoring for real-time performance tracking via smartphone, backed by a 10-year warranty
Documentation handled:
Permits, subsidy claims, DISCOM updates, and grid connection paperwork managed from their end
Transparent process:
Fixed pricing from quotation to handover with no hidden costs
Earthwave operates offices in Surat, Gujarat and Bhopal, Madhya Pradesh, and is currently expanding into multiple states.
SCADA collects real-time data from all devices in your plant, including inverters, meters, and sensors, and logs it for analysis and remote control. Without SCADA, you have no structured way to detect faults, analyze performance degradation, or meet utility reporting requirements for plants above 100 kW.
Your dashboard must show Performance Ratio (PR), Capacity Utilization Factor (CUF), Specific Yield (kWh/kWp), inverter availability, and irradiance-corrected generation versus expected output. These five metrics tell you whether the plant is healthy, underperforming, or experiencing a specific fault condition.
String monitoring tracks the current from individual string groups within your array. When one string underperforms due to soiling, shading, or a blown fuse, the deviation triggers an alert the same day instead of going unnoticed for weeks. This is the layer basic inverter portals do not provide.
GHI (Global Horizontal Irradiance) measures sunlight on a flat horizontal surface. POA (Plane of Array Irradiance) measures sunlight on your panel surface at its actual tilt angle. Using POA data for performance calculations gives you 5% to 12% more accurate results than using GHI, especially at higher tilt angles.
Remote monitoring requires an IoT data logger at site connected to your inverters and sensors, a cloud platform that stores and displays the data, and a mobile app or web dashboard for your team. Your system should push data every 5 to 15 minutes with redundant connectivity so there are no gaps in your performance record.
If your current setup relies on inverter portals, manual site visits, or monthly reports, you are managing a significant asset with incomplete information.
Talk to the Earthwave Solar team. They have been designing and delivering solar plants from 30 kW rooftops to 80 MW ground mounts since 2018, and their commercial installations include real-time monitoring as a standard component of delivery.
Contact Earthwave Solar:
Website:
Phone (Gujarat): +91 90336 07212
Phone (M.P.): +91 90336 02156
Email:
FAQS
Can't find the answer you're looking for? Our team is here to help.
SUBSCRIBE NEWSLETTER
Switching to solar is easier than you think. Let us guide you to cleaner, more affordable energy.
